
American politics is deeply divided along partisan lines – and for many Americans, the choice between the two parties feels stark, even existential.
But beneath that familiar red-blue partisan divide is a much more nuanced picture: Many Americans hold a complex mix of values and beliefs that don’t always fit neatly into either major party.
The 2026 Pew Research Center Political Typology
% of U.S. adults in each typology group
Source: Survey of U.S. adults conducted Nov. 17-30, 2025.
PEW RESEARCH CENTER
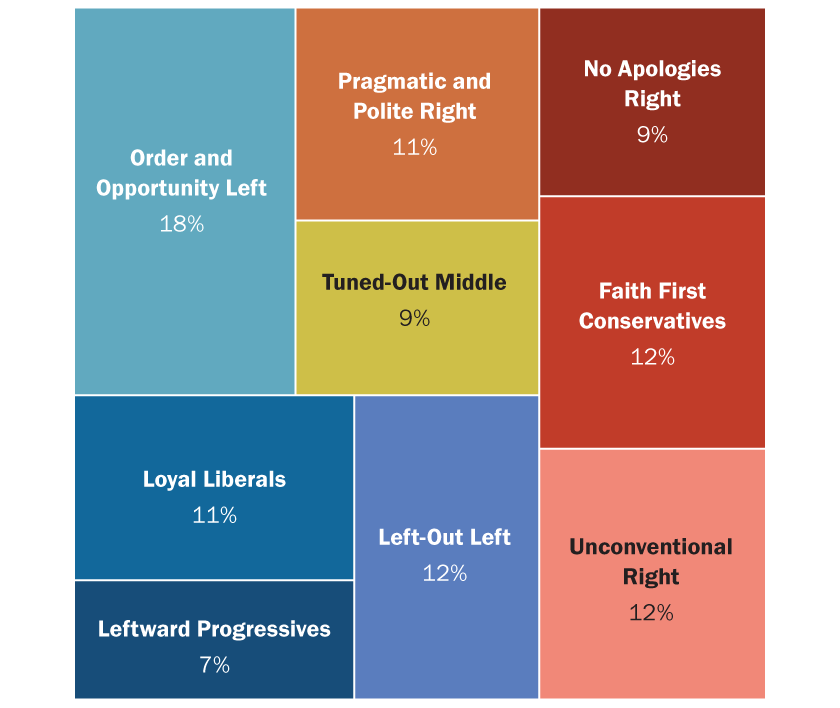
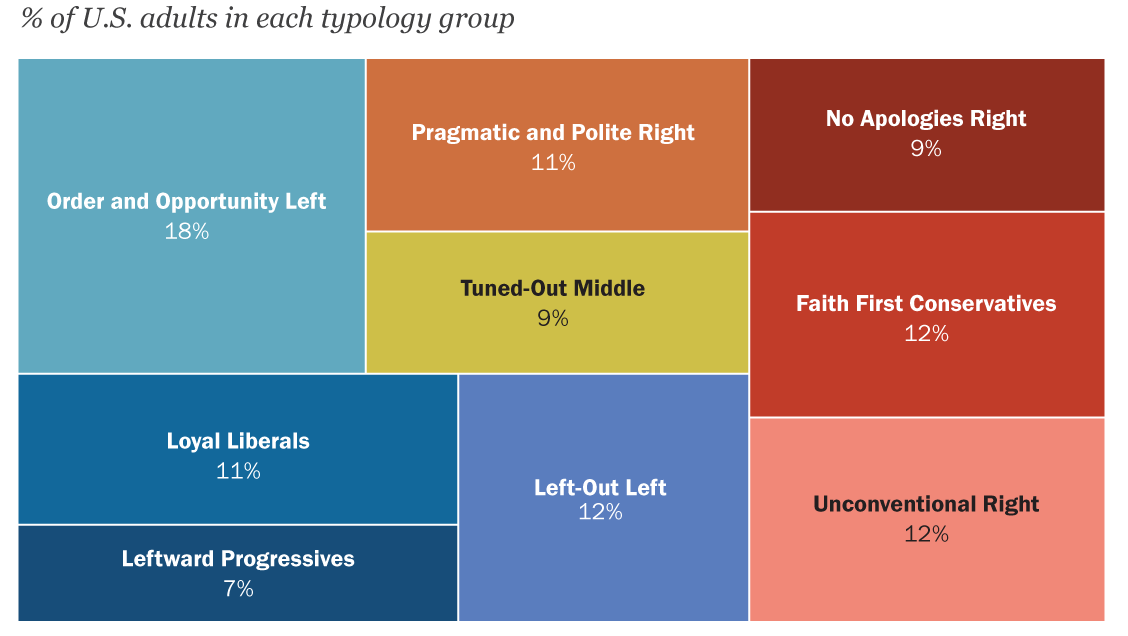
The 2026 Pew Research Center Political Typology
% of U.S. adults in each typology group
| Typology group | % |
|---|---|
| Leftward Progressives | 7% |
| Loyal Liberals | 11% |
| Left-Out Left | 12% |
| Order and Opportunity Left | 18% |
| Tuned-Out Middle | 9% |
| Pragmatic and Polite Right | 11% |
| Unconventional Right | 12% |
| Faith First Conservatives | 12% |
| No Apologies Right | 9% |
Source: Survey of U.S. adults conducted Nov. 17-30, 2025.
PEW RESEARCH CENTER
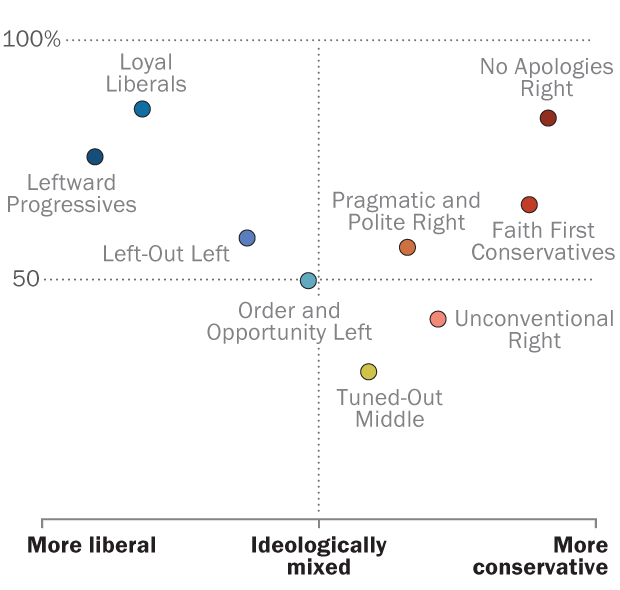
Pew Research Center’s new political typology shows how this complexity plays out, sorting the public into nine distinct groups based on their political and cultural values, not their party. The result is a picture of American politics with far more than two colors in it.
A few groups are very ideological, partisan and politically active. But they are a minority: Most Americans fall into groups within a large, politically messy center – even as many of them clearly favor one party over the other.
These cross-cutting sets of values present challenges for both the Republican and Democratic parties. To build winning coalitions, they must address the concerns of people who don’t fully support either party’s agenda.
The typology groups
The most ideological and partisan
Four groups are highly ideological, politically engaged and overwhelmingly back one party over the other – two on the right and two on the left.
The right anchors (21% of the public)
On the right, two groups are dominated by conservative Republicans who are unwaveringly supportive of President Donald Trump: No Apologies Right and Faith First Conservatives.
The two groups share many conservative values, but they differ in both emphasis and style. No Apologies Right take harder-line positions on most issues, but Faith First Conservatives stand out more on topics closely tied to religion, morality and social traditionalism. Both groups are majority Christian, and they are largely male and White – though to varying degrees.
The left anchors (17% of the public)
On the left, the counterpart groups are Leftward Progressives and Loyal Liberals. Both are highly educated, largely White groups of primarily liberal Democrats and Democratic leaners. They are also very politically engaged and overwhelmingly critical of Trump.
Leftward Progressives are the youngest typology group, with very progressive views across the board. They almost universally back Democrats over Republicans, but they cast a somewhat skeptical eye toward the Democratic Party.
In contrast, Loyal Liberals are far more attached to the Democratic Party, have greater trust in institutions and are more invested in the United States’ role as a leader in international diplomacy. While progressive on most issues, they are not as far to the left as Leftward Progressives on some issues – including economic policy.
These four groups are more politically interested and active than others, so their voices are amplified in U.S. politics. Still, they make up relatively small shares of the public.
Where do you fit in the political typology?

More politically mixed groups
Americans in the other five groups are more mixed in their political values – and in some cases, much less attentive to politics. Together, these five groups make up a majority of the public.
Right-leaning, but mixed partisanship (23% of the public)
Unconventional Right are decidedly Republican-oriented and generally conservative. But they take somewhat more moderate stances than the more conservative groups on issues like abortion and the social safety net. They are younger than those groups and much less politically engaged. Those who voted in 2024 overwhelmingly backed Trump. But he has lost more ground among this group than others since taking office: Just 53% approve of his job performance as of spring 2026.
Pragmatic and Polite Right also tilt Republican, but by a more modest margin (56% are Republicans or Republican leaners, 37% are Democrats or Democratic leaners). They are conservative on economic issues and more moderate on race and immigration. The oldest group, they also place a high value on civility in politics. While those who voted in 2024 favored Trump (54% vs. 40% for then-Vice President Kamala Harris), nearly two-thirds now disapprove of Trump’s job performance.
Left-leaning, but mixed partisanship (30% of the public)
Order and Opportunity Left are by far the largest typology group, making up 18% of the public. They lean Democratic, but not universally so (65% are Democrats and Democratic leaners, 25% are Republicans and GOP leaners). One of the most racially and ethnically diverse groups, they are economically liberal but are more concerned about crime and more supportive of immigration restrictions than other majority-Democratic groups.
Left-Out Left are overwhelmingly Democratic-oriented, with a mix of liberal and moderate views. One of the most financially stressed groups, they are more likely than most other groups to feel politically ignored. They also are deeply skeptical about politics and the future of the nation.
Divided and disconnected (9% of the public)
Finally, Tuned-Out Middle are politically divided and have an exceptionally low level of interest in politics.
The 2026 political typology is the ninth in a series dating back to 1987. This year’s typology groups are based on a survey of 10,357 U.S. adults conducted Nov. 17-30, 2025. The analysis in this report also draws on several additional surveys conducted with these same respondents from January 2025 through April 2026.
The political typology reveals values gaps in the public that go beyond traditional partisan divides and underscore the challenges both parties face in bringing together broad coalitions.
Some key divides on the right: Social and cultural issues, political style – and Trump
While economic conservatism unites groups to the right, the two most conservative groups differ from the other groups on several other issues.
No Apologies Right and Faith First Conservatives diverge from other right-leaning groups on some cultural issues
% who say …

Note: For full question wordings and distributions, refer to the detailed tables.
Source: Surveys of U.S. adults conducted Nov. 17-30, 2025, and Jan. 20-26, 2026.
PEW RESEARCH CENTER
No Apologies Right and Faith First Conservatives diverge from other right-leaning groups on some cultural issues
% who say …
| Leftward Progressives | Loyal Liberals | Left-Out Left | Order & Opportunity Left | Tuned-Out Middle | Pragmatic & Polite Right | Unconventional Right | Faith First Conservatives | No Apologies Right | |
|---|---|---|---|---|---|---|---|---|---|
| They are extremely/very comfortable with people openly carrying guns in public places | 3 | 2 | 19 | 8 | 22 | 12 | 24 | 55 | 70 |
| It is extremely/very important for U.S. to have a culture based in Christian religious beliefs | 1 | 3 | 7 | 29 | 43 | 42 | 31 | 82 | 68 |
| Abortion should be illegal in all/most cases | 2 | 4 | 15 | 27 | 50 | 46 | 43 | 83 | 73 |
Note: For full question wordings and distributions, refer to the detailed tables.
Source: Surveys of U.S. adults conducted Nov. 17-30, 2025, and Jan. 20-26, 2026.
PEW RESEARCH CENTER
No Apologies Right and Faith First Conservatives are distinct from other groups on abortion, gun policies, the role of Christianity in American life and other cultural issues.
For example, 83% of Faith First Conservatives and 73% of No Apologies Right say abortion should be illegal in all or most cases. That drops to 46% among Pragmatic and Polite Right and 43% among Unconventional Right.
Clear majorities of Faith First Conservatives (82%) and No Apologies Right (68%) also think it is extremely or very important that the U.S. have a culture based in Christian religious beliefs. This is a minority viewpoint in every other typology group.
At the same time, groups on the right are divided as much, if not more, by tone and political style as by policy.
- 53% of No Apologies Right say they like it when politicians they agree with humiliate opponents.
- Far smaller shares of Faith First Conservatives (27%) and Unconventional Right (28%) say this.
- Pragmatic and Polite Right overwhelmingly reject this style of politics – just 5% say they like seeing political opponents humiliated.
And these style differences show through in how each group views Donald Trump.
Trump viewed as best recent president among No Apologies Right and Faith First Conservatives, while Reagan leads among other GOP-oriented groups
% who say each has done the best job as president over the past 40 years

Note: No answer responses and estimates below 1% are not shown.
Source: Surveys of U.S. adults conducted Nov. 17-30, 2025, and Jan. 20-26, 2026.
PEW RESEARCH CENTER
Trump viewed as best recent president among No Apologies Right and Faith First Conservatives, while Reagan leads among other GOP-oriented groups
% who say each has done the best job as president over the past 40 years
| Donald Trump | George W. Bush | George H.W. Bush | Ronald Reagan | Joe Biden | Barack Obama | Bill Clinton | |
|---|---|---|---|---|---|---|---|
| Total | 19 | 4 | 3 | 21 | 2 | 36 | 11 |
| No Apologies Right | 63 | 1 | 1 | 32 | 0 | <1 | 2 |
| Faith First Conservatives | 52 | 2 | 2 | 38 | 0 | 1 | 2 |
| Unconventional Right | 26 | 7 | 7 | 35 | <1 | 13 | 9 |
| Pragmatic and Polite Right | 14 | 6 | 6 | 36 | <1 | 23 | 11 |
| Tuned-Out Middle | 12 | 12 | 7 | 15 | 2 | 36 | 12 |
| Order and Opportunity Left | 7 | 5 | 3 | 14 | 2 | 52 | 13 |
| Left-Out Left | 2 | 5 | 2 | 11 | 2 | 58 | 16 |
| Loyal Liberals | 1 | 1 | 1 | 2 | 5 | 71 | 18 |
| Leftward Progressives | 1 | <1 | <1 | 1 | 4 | 79 | 10 |
Note: No answer responses and estimates below 1% are not shown.
Source: Surveys of U.S. adults conducted Nov. 17-30, 2025, and Jan. 20-26, 2026.
PEW RESEARCH CENTER
No Apologies Right remain unflinching fans of Trump, with Faith First Conservatives close behind. But other groups on the right are not as “all in” on the president.
No Apologies Right continue to overwhelmingly approve of Trump’s job performance: 90% do so, and 63% say he is the best president of the last 40 years.
Trump rates nearly as highly among Faith First Conservatives: 81% approve, and 52% name him as the best recent president.
But Unconventional Right and Pragmatic and Polite Right diverge on both measures: Just 53% of Unconventional Right and 36% of Pragmatic and Polite Right approve of Trump’s job performance. Both groups are also more likely to name Ronald Reagan as the best president of the last four decades than to say this about Trump.
Some key divides on the left: Crime, economics, gender identity – and feelings about the Democratic Party
Typology groups on the left broadly share views on the social safety net, the value of diversity and opposition to Trump. But there are clear divisions.
Order and Opportunity Left and Left-Out Left are more moderate than Leftward Progressives and Loyal Liberals on sexuality and gender identity. The groups also diverge from those further to the left on issues of security and crime.
Views of social issues, economic outlook differ across the left-of-center groups
% who say …
| Leftward Progressives | |
| Loyal Liberals | |
| Left-Out Left |
| Order and Opportunity Left | |
| Tuned-Out Middle | |
| Pragmatic and Polite Right |
| Unconventional Right | |
| Faith First Conservatives | |
| No Apologies Right |
Violent crime is a very big problem in the country today
Americans have little/no control over how financially successful they will be in life
They are extremely/very comfortable with people using “they/them” pronouns
Note: For full question wordings and distributions, refer to the detailed tables.
Source: Surveys of U.S. adults conducted Nov. 17-30, 2025, and April 20-26, 2026.
PEW RESEARCH CENTER
Views of social issues, economic outlook differ across the left-of-center groups
% who say …
| Typology group | Violent crime is a very big problem in the country today | Americans have little/no control over how financially successful they will be in life | They are extremely/very comfortable with people using “they/them” pronouns |
|---|---|---|---|
| Leftward Progressives | 18 | 81 | 92 |
| Loyal Liberals | 19 | 33 | 69 |
| Left-Out Left | 43 | 65 | 38 |
| Order and Opportunity Left | 53 | 29 | 14 |
| Tuned-Out Middle | 51 | 52 | 24 |
| Pragmatic and Polite Right | 54 | 16 | 11 |
| Unconventional Right | 45 | 24 | 11 |
| Faith First Conservatives | 57 | 17 | 3 |
| No Apologies Right | 65 | 11 | 4 |
Note: For full question wordings and distributions, refer to the detailed tables.
Source: Surveys of U.S. adults conducted Nov. 17-30, 2025, and April 20-26, 2026.
PEW RESEARCH CENTER
And Leftward Progressives are more critical than other groups of the economic system and more skeptical of U.S. military power.
Leftward Progressives and Left-Out Left share a skepticism of the Democratic Party – though their frustrations are not the same.
While very liberal, Leftward Progressives are not overwhelmingly positive about the Democratic Party
% who have a favorable view of …

Source: Surveys of U.S. adults conducted Nov. 17-30, 2025, and April 20-26, 2026.
PEW RESEARCH CENTER
While very liberal, Leftward Progressives are not overwhelmingly positive about the Democratic Party
% who have a favorable view of …
| Typology group | The Republican Party | The Democratic Party |
|---|---|---|
| No Apologies Right | 83 | 1 |
| Faith First Conservatives | 82 | 3 |
| Unconventional Right | 65 | 18 |
| Pragmatic and Polite Right | 45 | 32 |
| Tuned-Out Middle | 43 | 49 |
| Order and Opportunity Left | 24 | 58 |
| Left-Out Left | 10 | 52 |
| Loyal Liberals | 2 | 77 |
| Leftward Progressives | 2 | 61 |
Source: Surveys of U.S. adults conducted Nov. 17-30, 2025, and April 20-26, 2026.
PEW RESEARCH CENTER
While 61% of Leftward Progressives view the Democratic Party favorably, that is far lower than among Loyal Liberals (77%). Left-Out Left are even less favorable: 52% rate the party positively.
Relatively small shares of Leftward Progressives (33%) and Left-Out Left (20%) also say the Democratic Party cares about people like them a great deal or quite a bit. By comparison, 48% of Loyal Liberals say it does.
But these two groups may have different reasons for their skepticism of the Democratic Party. For example, Leftward Progressives are far more liberal than Left-Out Left: 66% of Leftward Progressives say they like politicians who identify as democratic socialists, compared with just 22% of Left-Out Left.
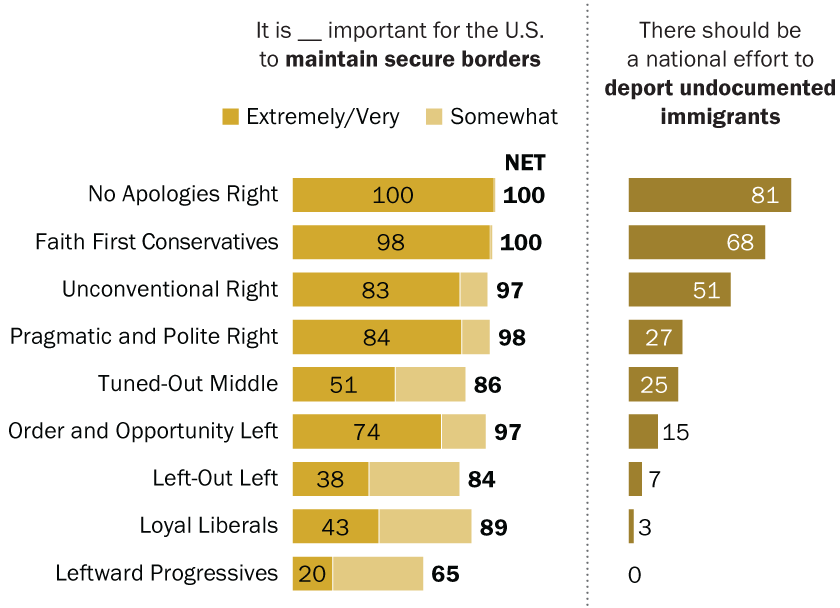
Immigration splits typology groups on both ends of the political spectrum
Faith First Conservatives and No Apologies Right stand out for their support for the Trump administration’s restrictive immigration policies: Clear majorities say undocumented immigrants should be deported. About half of Unconventional Right say the same.
Immigration policy divides groups on both the left and the right
% who say …
Source: Surveys of U.S. adults conducted June 2-8 and Nov. 17-30, 2025.
PEW RESEARCH CENTER
Immigration policy divides groups on both the left and the right
% who say …
| Typology group | Extremely/Very important for the U.S.to maintain secure borders | Somewhat important for the U.S.to maintain secure borders | There should be a national effort to deport undocumented immigrants |
|---|---|---|---|
| No Apologies Right | 100% | <1% | 81% |
| Faith First Conservatives | 98% | 1% | 68% |
| Unconventional Right | 83% | 14% | 51% |
| Pragmatic and Polite Right | 84% | 14% | 27% |
| Tuned-Out Middle | 51% | 35% | 25% |
| Order and Opportunity Left | 74% | 22% | 15% |
| Left-Out Left | 38% | 45% | 7% |
| Loyal Liberals | 43% | 46% | 3% |
| Leftward Progressives | 20% | 45% | 0% |
Source: Surveys of U.S. adults conducted June 2-8 and Nov. 17-30, 2025.
PEW RESEARCH CENTER
In contrast, majorities in all the other typology groups – including Pragmatic and Polite Right – say there should be a path to legal status for those currently living in the U.S. illegally.
At the same time, wide majorities in most typology groups, including Order and Opportunity Left, say it is extremely or very important for the U.S. to maintain secure borders. The three leftmost groups are less likely to hold this view, though 43% of Loyal Liberals and 38% of Left-Out Left say this – compared with just 20% of Leftward Progressives.
To learn more about each group’s characteristics, explore the typology group profiles:
No Apologies Right | Faith First Conservatives | Unconventional Right | Pragmatic and Polite Right | Tuned-Out Middle | Order and Opportunity Left | Left-Out Left | Loyal Liberals | Leftward Progressives
Dive deeper on the typology groups
Typology groups and the Democratic and Republican parties
Though two of the typology groups are almost exclusively made up of Democrats and two are nearly all Republican (including leaners), this typology was developed without taking partisan affiliation into account.
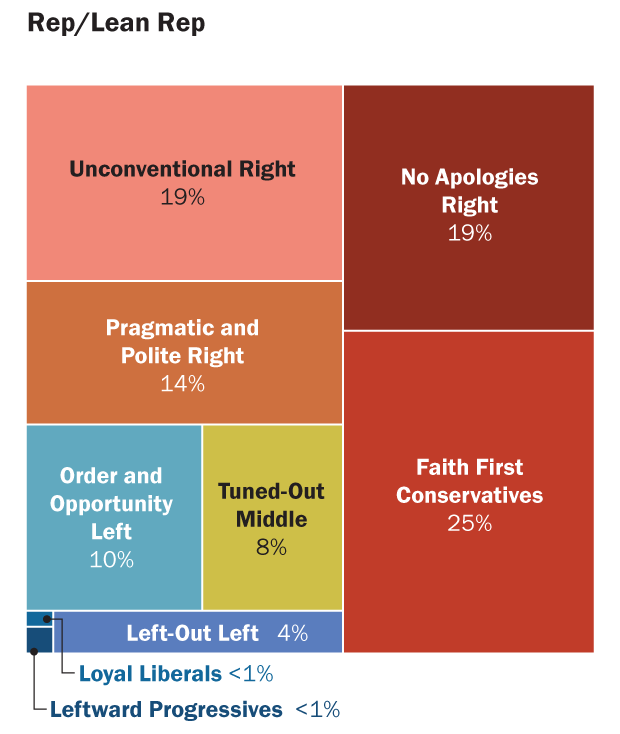
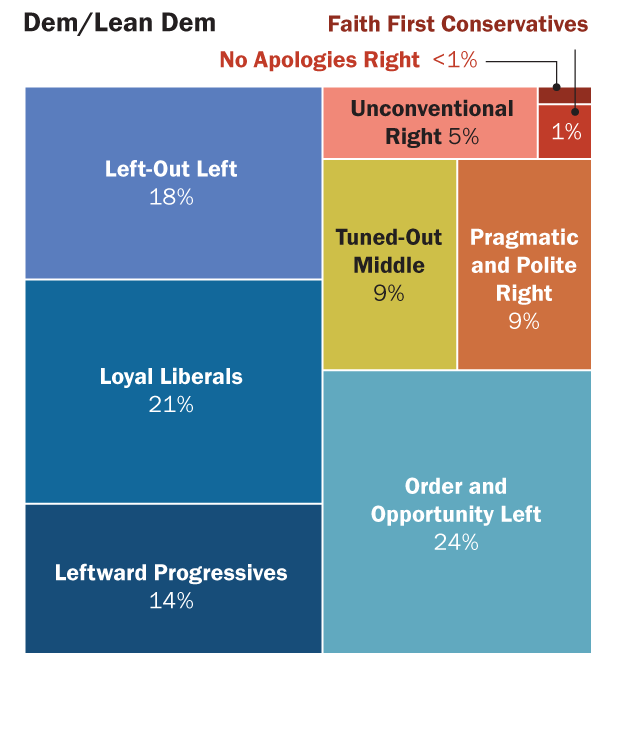
The political diversity of the Republican and Democratic parties
% who are in each typology group
Source: Survey of U.S. adults conducted Nov. 17-30, 2025.
PEW RESEARCH CENTER
The political diversity of the Republican and Democratic parties
% who are in each typology group
| Typology group | Rep/Lean Rep | Dem/Lean Dem |
|---|---|---|
| No Apologies Right | 19 | <1 |
| Faith First Conservatives | 25 | 1 |
| Unconventional Right | 19 | 5 |
| Pragmatic and Polite Right | 14 | 9 |
| Tuned-Out Middle | 8 | 9 |
| Order and Opportunity Left | 10 | 24 |
| Left-Out Left | 4 | 18 |
| Loyal Liberal | <1 | 21 |
| Leftward Progressive | <1 | 14 |
Source: Survey of U.S. adults conducted Nov. 17-30, 2025.
PEW RESEARCH CENTER
The typology highlights that most Americans – in both partisan coalitions – are neither consistently liberal nor consistently conservative in their values. In fact, roughly 15% of those who call themselves Republicans or Republican leaners have a set of political values that place them in groups to the left of center overall – and a similar share of Democrats have values that place them in groups that are more right of center.
For more on partisanship and the typology, read “How the political typology groups feel about the Republican and Democratic parties.”
Political engagement
By all measures, Loyal Liberals and No Apologies Right are the most politically engaged, with Faith First Conservatives and Leftward Progressives close behind. These groups are more likely to vote, to follow and talk about politics, and to say that it really matters which party wins in the upcoming midterm elections.
More ideologically consistent groups are more invested in the midterm elections than others
% who say it really matters which party wins control of Congress in the November 2026 elections
Source: Surveys of U.S. adults conducted Nov. 17-30, 2025, and Jan. 20-26, 2026.
PEW RESEARCH CENTER
More ideologically consistent groups are more invested in the midterm elections than others
% who say it really matters which party wins control of Congress in the November 2026 elections
| Typology group | It really matters which party wins control of Congress in the November 2026 elections |
|---|---|
| No Apologies Right | 84 |
| Faith First Conservatives | 66 |
| Unconventional Right | 42 |
| Pragmatic and Polite Right | 57 |
| Tuned-Out Middle | 31 |
| Order and Opportunity Left | 50 |
| Left-Out Left | 59 |
| Loyal Liberals | 86 |
| Leftward Progressives | 76 |
Source: Surveys of U.S. adults conducted Nov. 17-30, 2025, and Jan. 20-26, 2026.
PEW RESEARCH CENTER
Other groups are less engaged – particularly Tuned-Out Middle.
For more on how the groups participate in politics, read “How voting, political participation and news sources differ across the political typology groups.”
Foreign policy values
Current foreign policy flashpoints – like Iran, Israel and Ukraine – and broad foreign policy values split the typology groups in several ways. Some largely track traditional partisan divides, but others split the coalitions. To explore some of these differences, read “How foreign policy values and issues cut across the political typology groups.”
Age, race and ethnicity
The typology also illuminates how Americans differ in their political values across demographic groups. In particular, there are notable differences in what typology groups are most common among younger and older adults and Americans of different racial and ethnic groups. For instance:
Age
Adults under 30 are more likely to be in groups to the left of center than older adults – especially Left-Out Left and Leftward Progressives.
Americans 65 and older, by comparison, are far more likely to be in some of the groups to the right – especially Pragmatic and Polite Right and No Apologies Right.
Race and ethnicity
Hispanic and Black adults are more likely than White adults to be in left-oriented groups, while White adults are more likely than other groups to be in right-oriented groups.
Even as they are less likely to be in left-oriented groups overall, White adults are more likely than Hispanic and Black adults to be Leftward Progressives or Loyal Liberals. In contrast, Hispanic and Black adults are especially concentrated in Left-Out Left and Order and Opportunity Left.
For more on how groups are distributed in the typology, read “The political typology illustrates the gaps in political values by age, race and ethnicity.”


